The S&P 500 opened the week again struggling to breakout above 4200. Some prognosticators think that a new rally will be confirmed once the Debt Ceiling is resolved and the Fed pauses rate increases at their next meeting (in early June). I’m not sure it will be that easy. Beyond the USA, economic conditions are in a slump…China’s COVID Re-opening has faded; Europe’s energy dilemma is resurging and the IMF has downgraded overall global growth to a paltry 2.8%.
I’m closely watching a wide array of indicators, many of which are flashing contradictory signals. Over the coming days, I’ll share several of the charts that I’m tracking. Spoiler Alert- the future is clear as mud.
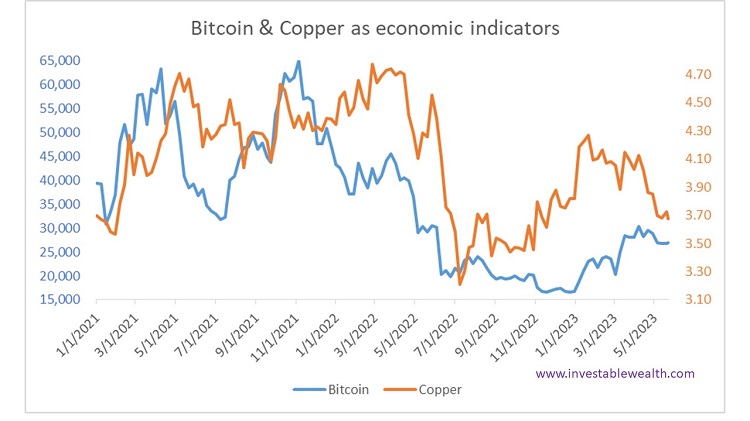
Two indicators that are moving contrary to the S&P 500’s upward trend are Bitcoin and Copper. What’s interesting about these two asset classes is that they’re generally considered to represent opposite ends of the economic spectrum…speculative Bitcoin and macro Copper.
Note the below chart, it’s not to scale. The purpose is not to compare absolute performance but rather to illustrate commonality of movement. Since the Pandemic excess, Copper has general lagged Bitcoin’s pattern- a double top followed by a significant drop to the bottom, then a failed recovery…and now Copper appears to be leading Bitcoin in a move lower. What I find interesting is the downward movement of these two distinct asset classes in comparison to the S&P 500’s alleged strength.
So which indicator is correct? Maybe all of them. Stay tuned for a digression into the most dangerous phrase in economics: “it’s different this time.”
If you find these ALERTs informative, please share them with a likeminded friend AND reference this post on your website or social media channels.
—————————————————–